October 13, 2015- GrilledSeismic
What is
seismic interpretation?
Seismic
interpretation is the process of obtaining geologic information from seismic data, especially
from reflections in the case of the oil and gas industry. This is the simplest
explanation in which most geophysicists would agree. Nonetheless, we could
write thousands of pages trying to explain everything involved around this methodology.
For this post, we will only focus on the basics.
Seismic
reflection.- Is the branch of exploration seismology dedicated to the
acquisition, processing and interpretation of data from the reflections of
acoustic waves in the different layers of the earth. Said reflections are
generated in seismic exploration through
controlled sources such as dynamite and seismic vibrators, known as vibroseis,
in land and, air guns (mostly) in the sea. This method is ruled by the acoustic
impedance (Z) property of the rocks in which the seismic waves travel through
the earth. Acoustic impedance (Z) is the result of the velocity of the seismic
waves (V) times the density (ρ) of the rock in which the waves travel (Z=V ρ). When the seismic waves travel through the subsurface
and find an interface with different acoustic impedance, part of the energy of
the waves is refracted and the other part is reflected. The reflected waves are
the ones of interest to us and we measure their travel time from the source to
the receivers. Knowing the travel time and the velocity of the seismic waves we
can reconstruct the path that the waves traveled to generate an image from the
subsurface through seismic processing.

Fig. 1.- (Stein and Wysession, 2003)
Seismic reflection data comprise:
-
Continuity of the reflections indication a geologic structure.
- Variability of the reflections indicating
stratigraphic changes, fluid presence
and the reservoir structure.
- The
seismic wavelet.
- Noises of different kinds and data
deffects.
Seismic
interpretation is the thoughtful process to separate this effects.
The seismic wavelet starts as a pulse, which is generated
through some artificial source and then travels down through the earth, it
reflects in an interface and travels back up to the surface where is recorded
by the receivers, bringing geologic information with it. This wavelet is
minimum phase and it has some bandwidth of some frequency and, during data
processing is converted (ideally) to a zero-phase wavelet, making the
interpretation easier and more accurate.

Fig. 2 Seismic line from the Gulf of Mexico
The
interpreter is not interested directly in the wavelet, but rather in the
geologic information it carries. Because of this, understanding the wavelet and
distinguishing its characteristics to define geologic details is one of the
most important tasks to the interpreter.
The
interpreter needs to know enough about the acquisition and processing of the
seismic data to take into account the effects of undesirable noise in the data
and not to think of it as the geologic features he is looking for. Noise is
always present in the data and it can be random, multiples reflections,
refracted energy or energy from an unknown source.
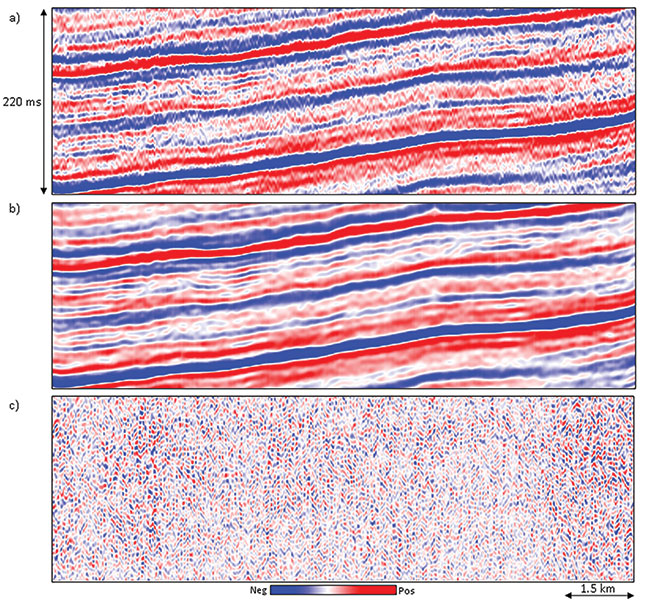
Fig. 3.- Vertical slice through a seismic volume showing the (a) before and (b) after a structural filter, and (c) difference. (Causes and Appearance of Noise in Seismic Data Volumes
By Satinder Chopra, Kurt Marfurt).
Another
step of seismic interpretation is the definition of the structural frame, which
is accomplished by following the continuity of the reflectors through the
seismic data, be it 2D or 3D. The continuity of the reflectors is ruled by the
sedimentary boundaries created at the time when they deposited, and the
structure imposed by the tectonic forces that worked on them. Following these continuities in an area and create
structural maps is then, one of the most basic and traditional activities in
seismic interpretation.
Once
the structural frame has been defined, it is time to go to the interpretation
of stratigraphic features and the look for hydrocarbons. The most important
part of this activity is the seismic amplitude, which can be presented or
extracted in many ways. The data loaded to the workstation must then be true
amplitude and zero-phase, and the interpreter must check that his data meets
this standard.

Fig. 4 Shows two vertical slices, interpreted faults and an interpreted horizon inside a seismic volume.
The
interpreter can continue to more advanced steps in the interpretation, such as
seismic attributes extraction, AVO (amplitude vs offset) analysis and seismic inversion,
but that will be the subject or other posts later.
References.
No hay comentarios.:
Publicar un comentario